How to debug a webpack app in the browser
You want to debug your JavaScript app that you made with webpack and you see this:
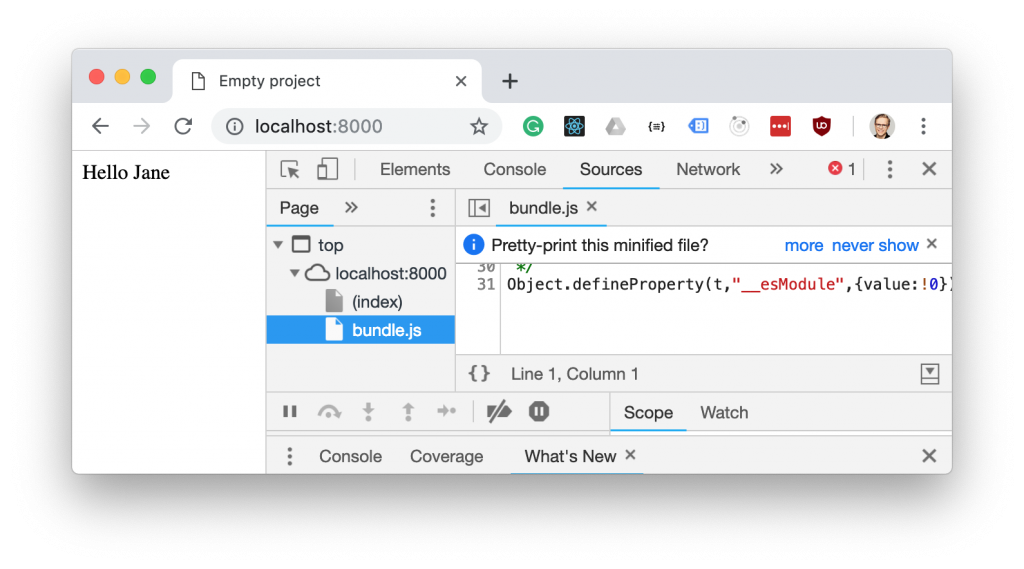
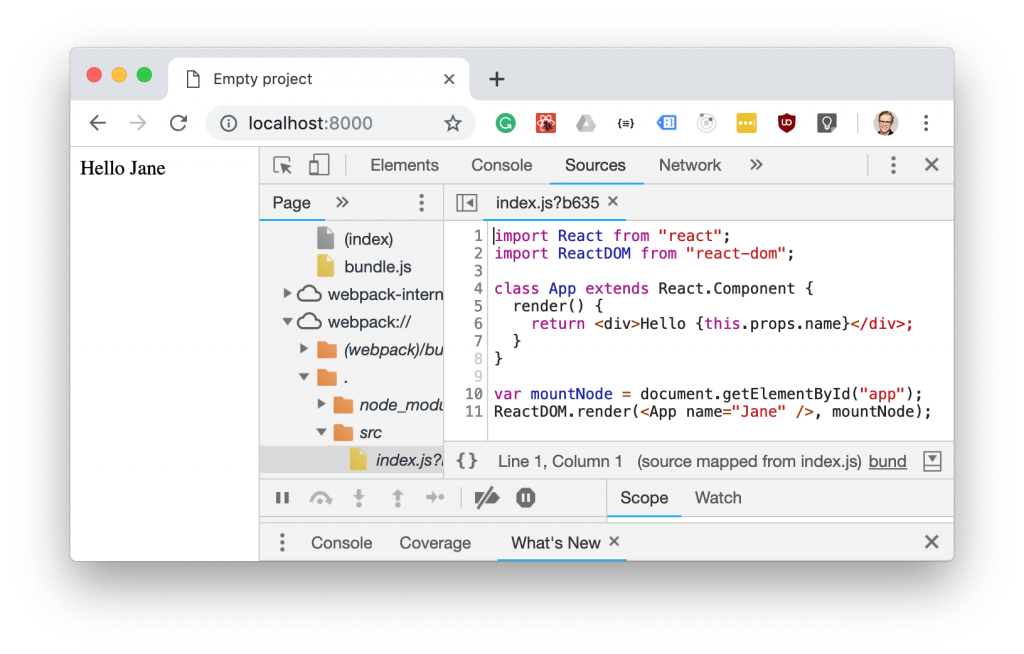
But the code that you wrote in your editor looks like this:
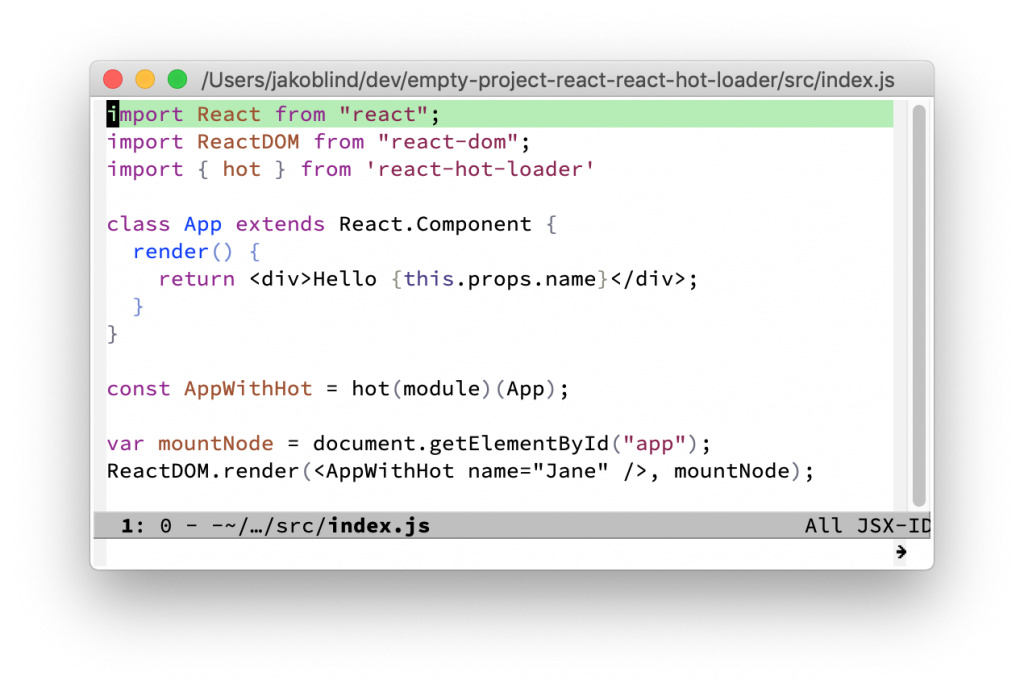
The code in the debugger is not the same as you wrote in your editor. You cannot work with that. Where are you supposed to set your breakpoints?
How to open the debugger to debug your webpack bundle
Before I tell you how to fix this, let’s go through all the steps you need to take to open up the debugger. First, you are on your web site in Chrome
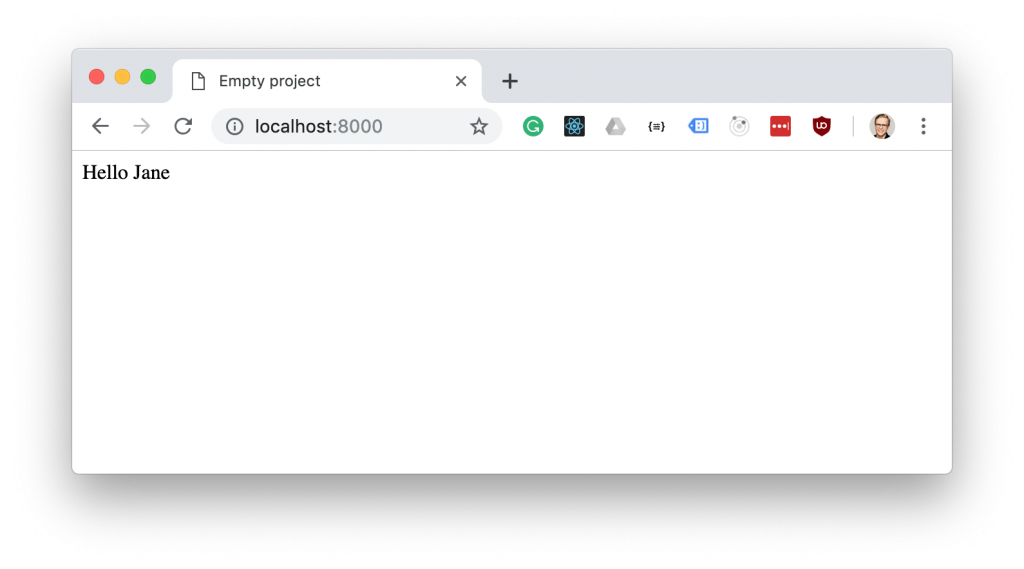
What you need to do now is to open the developer tools in Chrome. Either right-click on your page and select “inspect element” or press CMD+SHIFT+i (or CTRL+SHIFT+i on Linux/Windows. Then you will see a new window popping up:
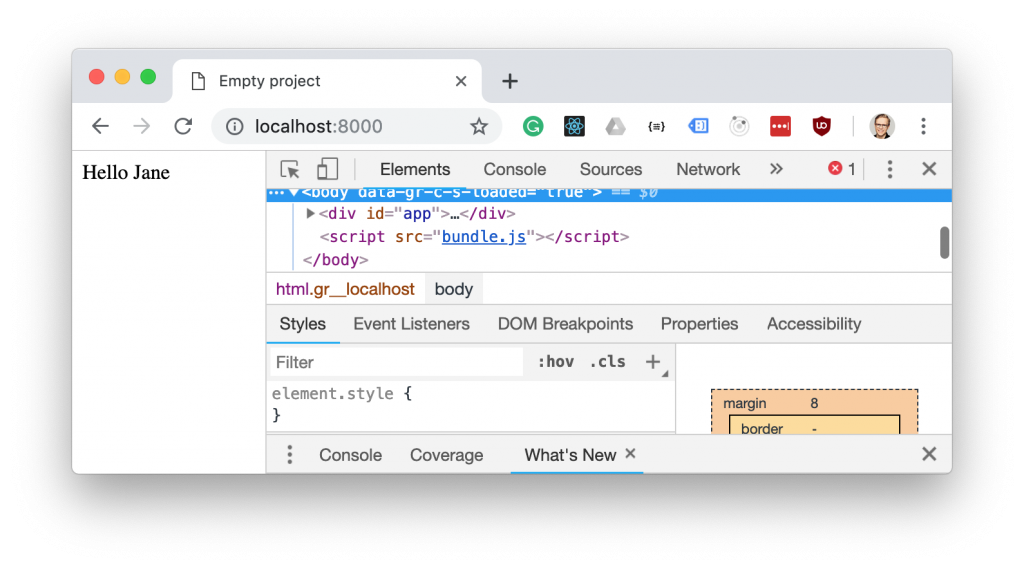
This is the developer tools. It has a bunch of features, but now we are going to the debugger. Press sources in the tab at the top.
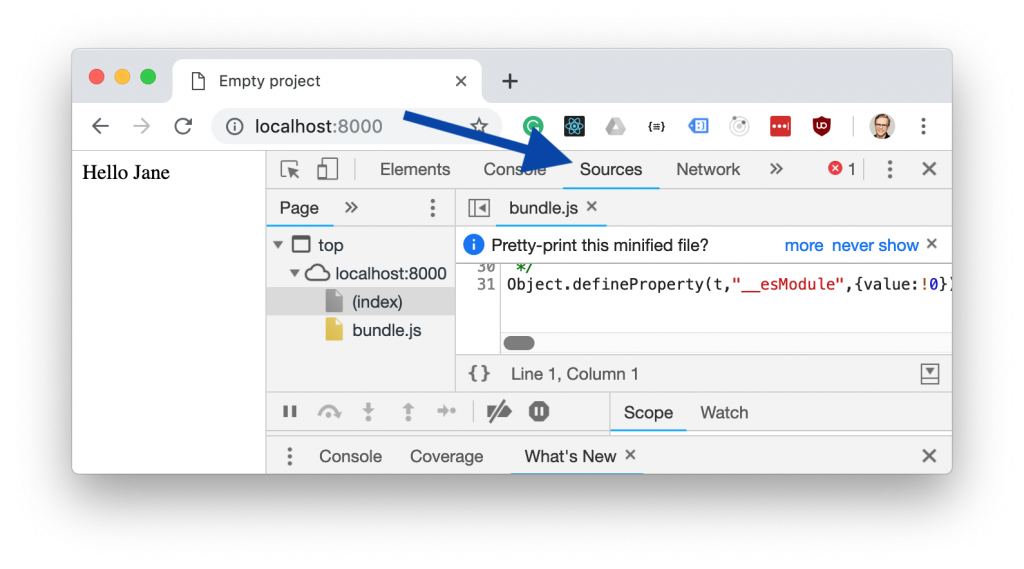
This will show all the files that are used in the app. Press bundle.js (the filename for the bundle of your app might have another name such as index.js)
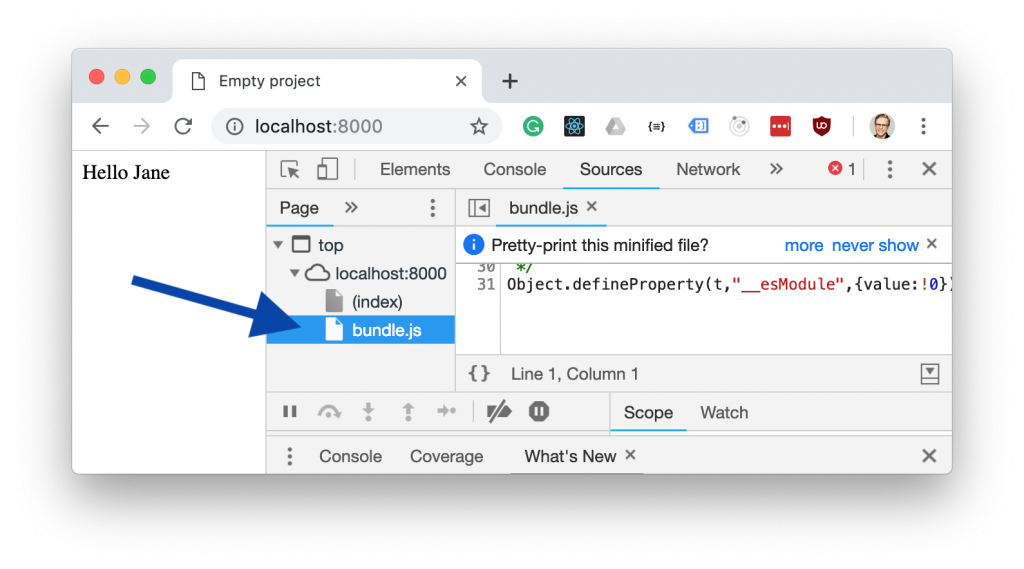
The code is not readable. To make it extra difficult it’s one big line. Click the {} at the bottom to expand it
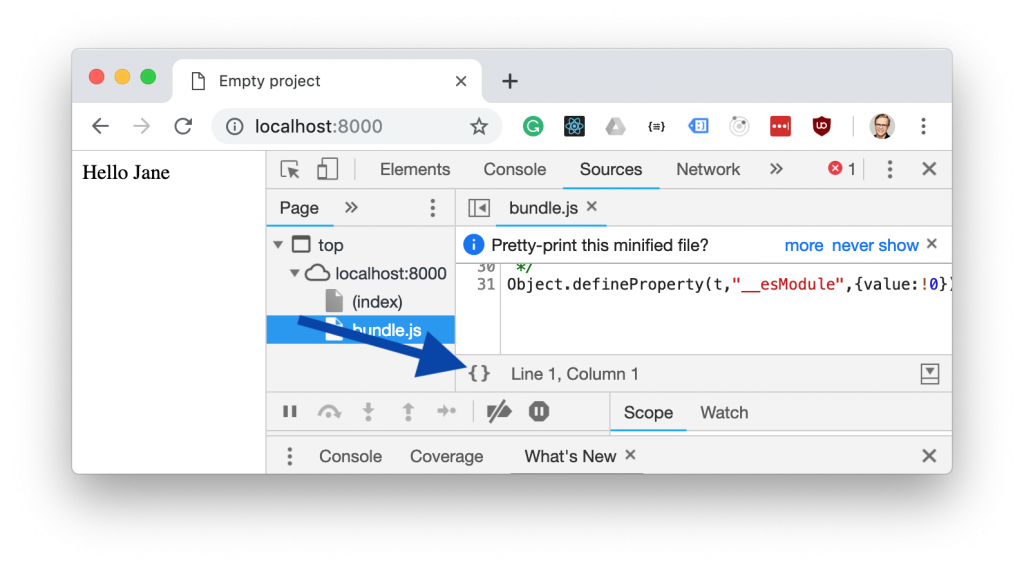
That expands the text but it’s still not quite the code you wrote in your editor.
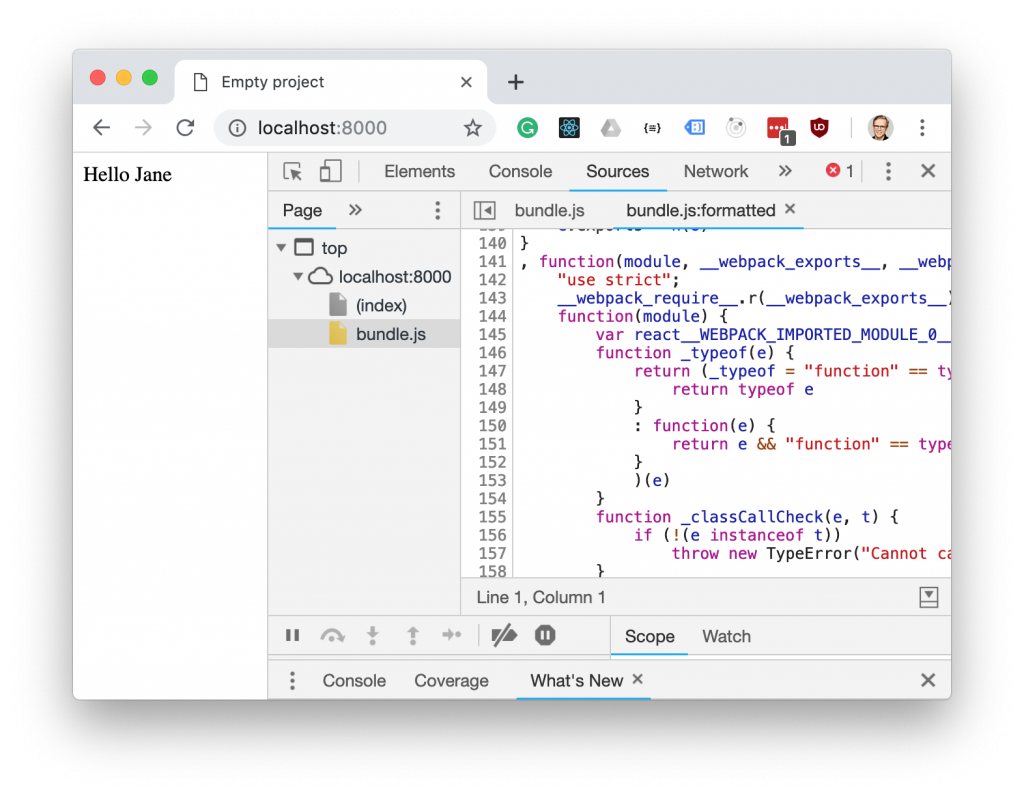
Why does the code look like that?
Webpack does a bunch of optimizations and minifications when you bundle your webpack code. This makes the app faster to load in the browsers - but more difficult to read for devs.

It’s the optimized bundle that you see in the browser.
How to enable webpack source maps to make it easy to debug
So how can you make the bundled webpack code look like the code in your editor that you actually wrote? The solution is called source maps.
Source maps is a text file with instructions that tell the browser how to translate the obfuscated code into how the code looked like before the bundeling.

You can enable webpack to create that file during the build process. That way, webpack spits out not only your bundle, but also the source maps as part of the build process.

Enable source maps in your webpack app to debug easier
There is a very easy way to enable source maps while developing. If you are using webpack 4 or later, just set webpack in development mode. In development mode, source maps are enabled automatically. There are two ways to set webpack in development mode. Either add this to your webpack config:
{
  mode: "development"
  // the rest of your webpack.config.js
}
Or add —mode development to your CLI that starts webpack
webpack -d --mode developmentNow rebuild your project and open up in the browser. You will be able to see the original code straight in your browser. From here you can set break points and debug !
Want to learn how to create a webpack app from scratch?
Now that you know how to debug a webpack app, you are probably curious about learning more about webpack basics. And what is a better way to learn webpack than to learn by coding a webpack app from scratch? I have put together a free mini-course that teaches you just that. It’s an email course that goes over 5 days. Sign up below!